Toolbox Chaos practical guide
Spectral Analysis
Compute a Welch power spectral density or a one-sided amplitude spectrum from a trajectory, with explicit transient and frequency-window choices.
Objective
What you will accomplish
Use frequency-domain summaries with correct units and without turning peaks or broadband content into unsupported dynamical classifications.
Before you begin
- Obtain a sufficiently sampled trajectory and inspect its time series first.
- Know the sampling step and, if physical units are claimed, the time and state-variable units.
Reference outputs
What these views can show
Procedure
Step-by-step workflow
-
Choose the spectral quantity
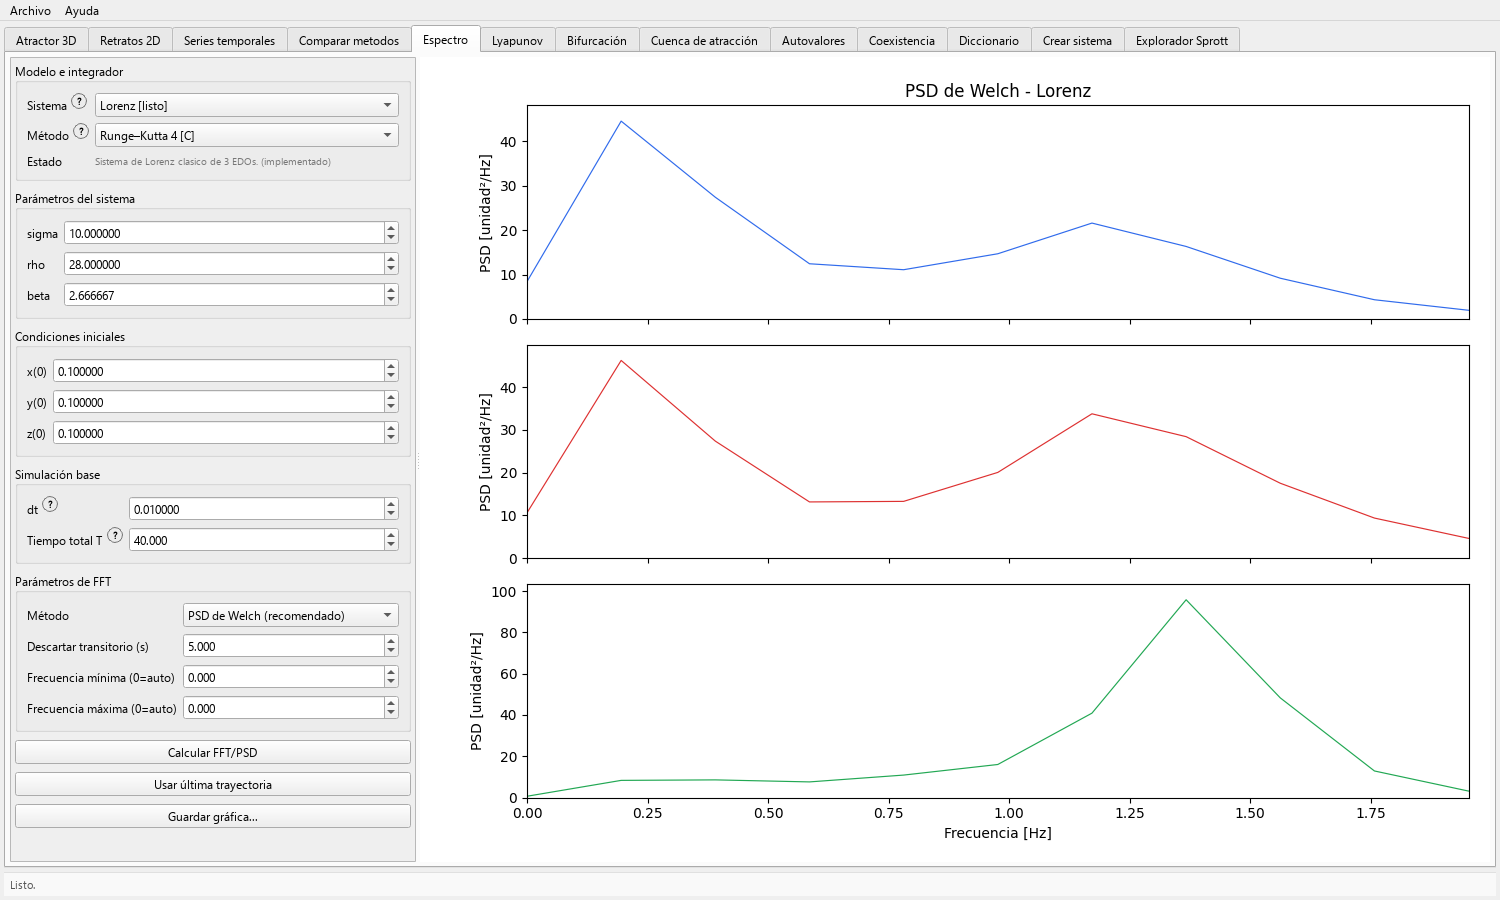
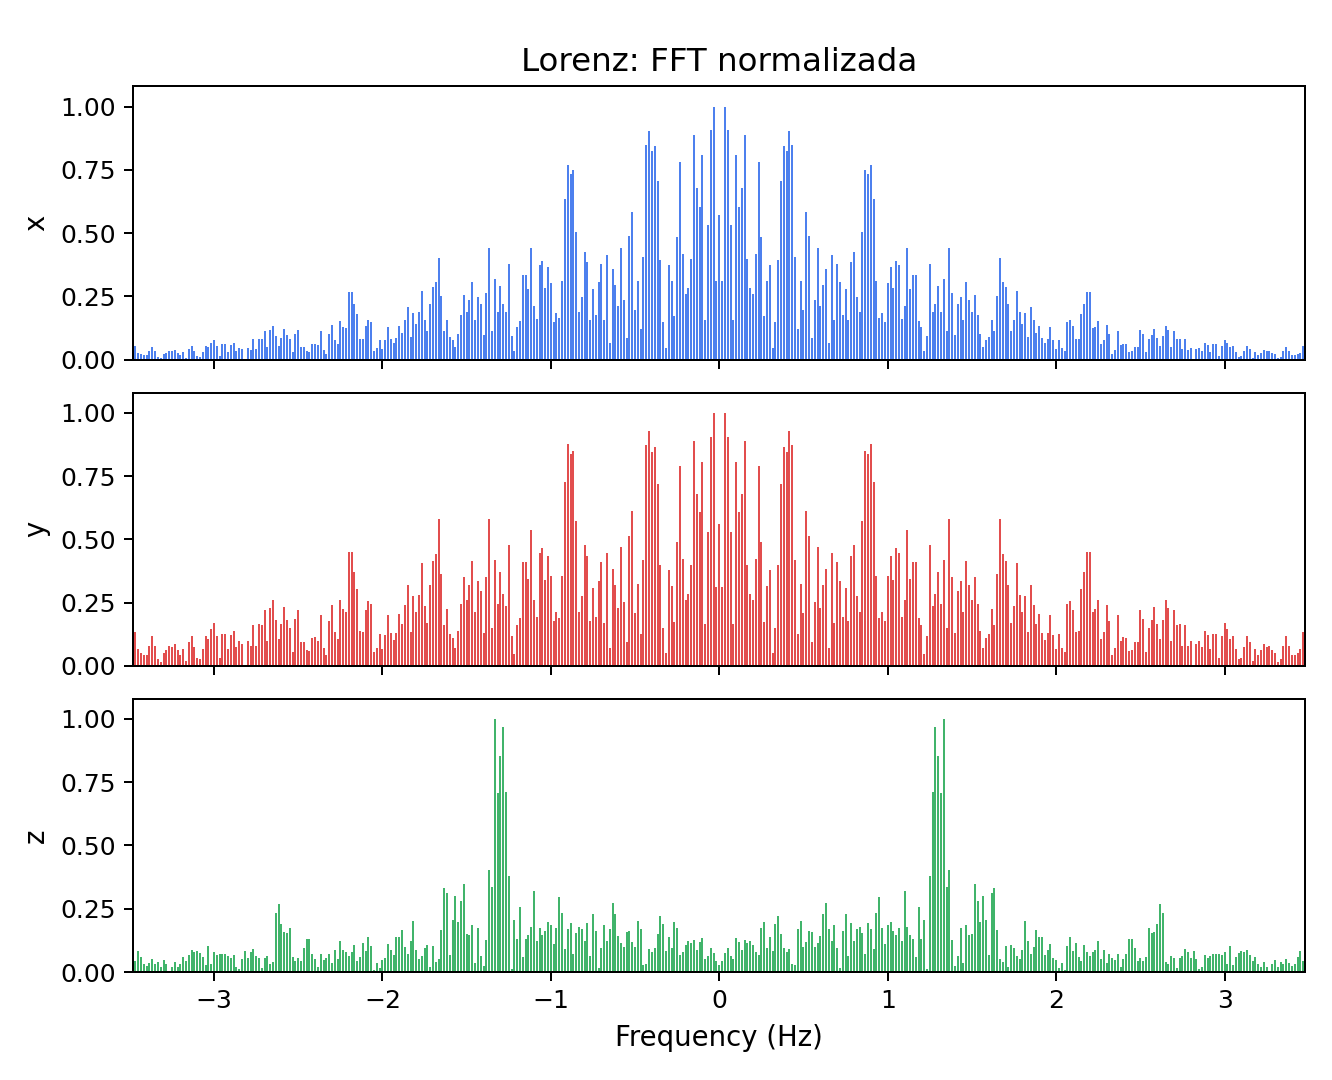
Select PSD de Welch for an averaged one-sided power spectral density with density scaling, or Espectro de amplitud for a one-sided Hann-windowed amplitude spectrum.
Do not call the amplitude spectrum a PSD. Their ordinate meanings and units are different.
-
Provide the trajectory
Run a local simulation or press Usar última trayectoria after confirming the source system and sampling step.
Use the same source trajectory when comparing Welch and amplitude modes so the difference is analytical rather than dynamical.
-
Discard a declared transient
Set Descartar transitorio to exclude the approach interval identified in the time-series view. The value must be shorter than the total trajectory.
Report the retained window length because it controls frequency resolution and statistical stability.
-
Set frequency limits
Leave both limits at zero for automatic display, or set a valid minimum and maximum to focus on a known band.
Never use display cropping to imply that omitted low- or high-frequency content is absent.
-
Calculate and compare states
Press Calcular FFT/PSD and inspect all displayed state spectra. Identify narrow peaks, harmonics, low-frequency energy, broad bands, and the noise floor or numerical floor.
Repeat with a longer retained window and a refined integration step when spectral claims matter.
-
Save with units and method
Export the graph and name the method in the caption. If a state has units U and time is in seconds, Welch density is expressed in U²/Hz; the amplitude spectrum is expressed in U.
Record sampling step, retained duration, transient, windowing/method label, and frequency crop.
Result
Expected output
- One spectrum per displayed state over a known retained time window.
- A method-specific interpretation that distinguishes power density from amplitude.
- A stability check using a longer window, smaller step, or both when conclusions depend on spectral structure.
Interpretation
How to read it
A narrow fundamental and harmonics are compatible with periodic or strongly oscillatory behavior. Broader content can be associated with irregular dynamics, modulation, transients, or numerical effects.
Welch averaging trades frequency resolution for variance reduction. The amplitude spectrum retains a different scale; neither output alone proves chaos or asymptotic behavior.
Export
Reproducibility checklist
- State Welch PSD or amplitude spectrum explicitly.
- Record units, step, retained duration, discarded transient, and frequency bounds.
- Keep the corresponding time-series figure from the same trajectory.
Applications
Where this workflow helps
- Identifying dominant oscillatory scales and harmonics.
- Comparing spectral changes across a controlled parameter series.
- Screening time series before more specialized signal or nonlinear-dynamics analysis.
Limits
What it does not establish
- Frequency content alone cannot certify periodicity, chaos, attraction, or hiddenness.
- Short records, unremoved transients, coarse sampling, and frequency cropping can produce misleading features.
- The GUI exposes Welch PSD and amplitude spectrum; do not attribute unexposed entropy, dimension, or advanced spectral APIs to this tab.