Toolbox Chaos practical guide
Export and Reproducibility
Save figures and model definitions together with the numerical contract, organize a compact result package, and make every comparison auditable.
Objective
What you will accomplish
Produce outputs that another researcher can identify, repeat, and interpret without relying on a screenshot of the controls.
Before you begin
- Decide on an experiment identifier and output folder before a multi-run study.
- Know which settings belong to the model, the initial state, the numerical method, the analysis, and the visual presentation.
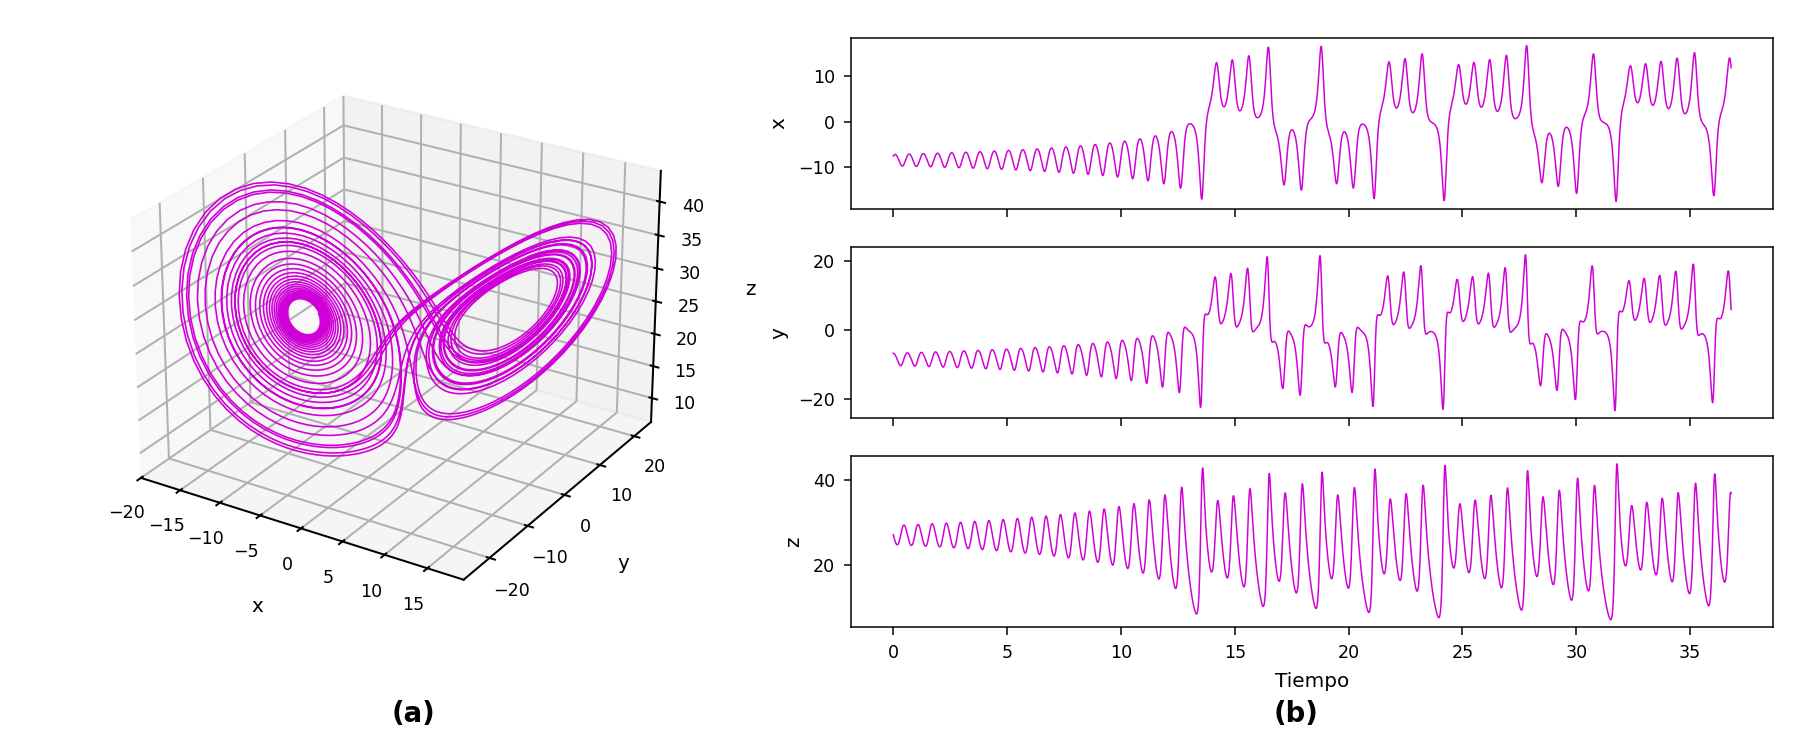
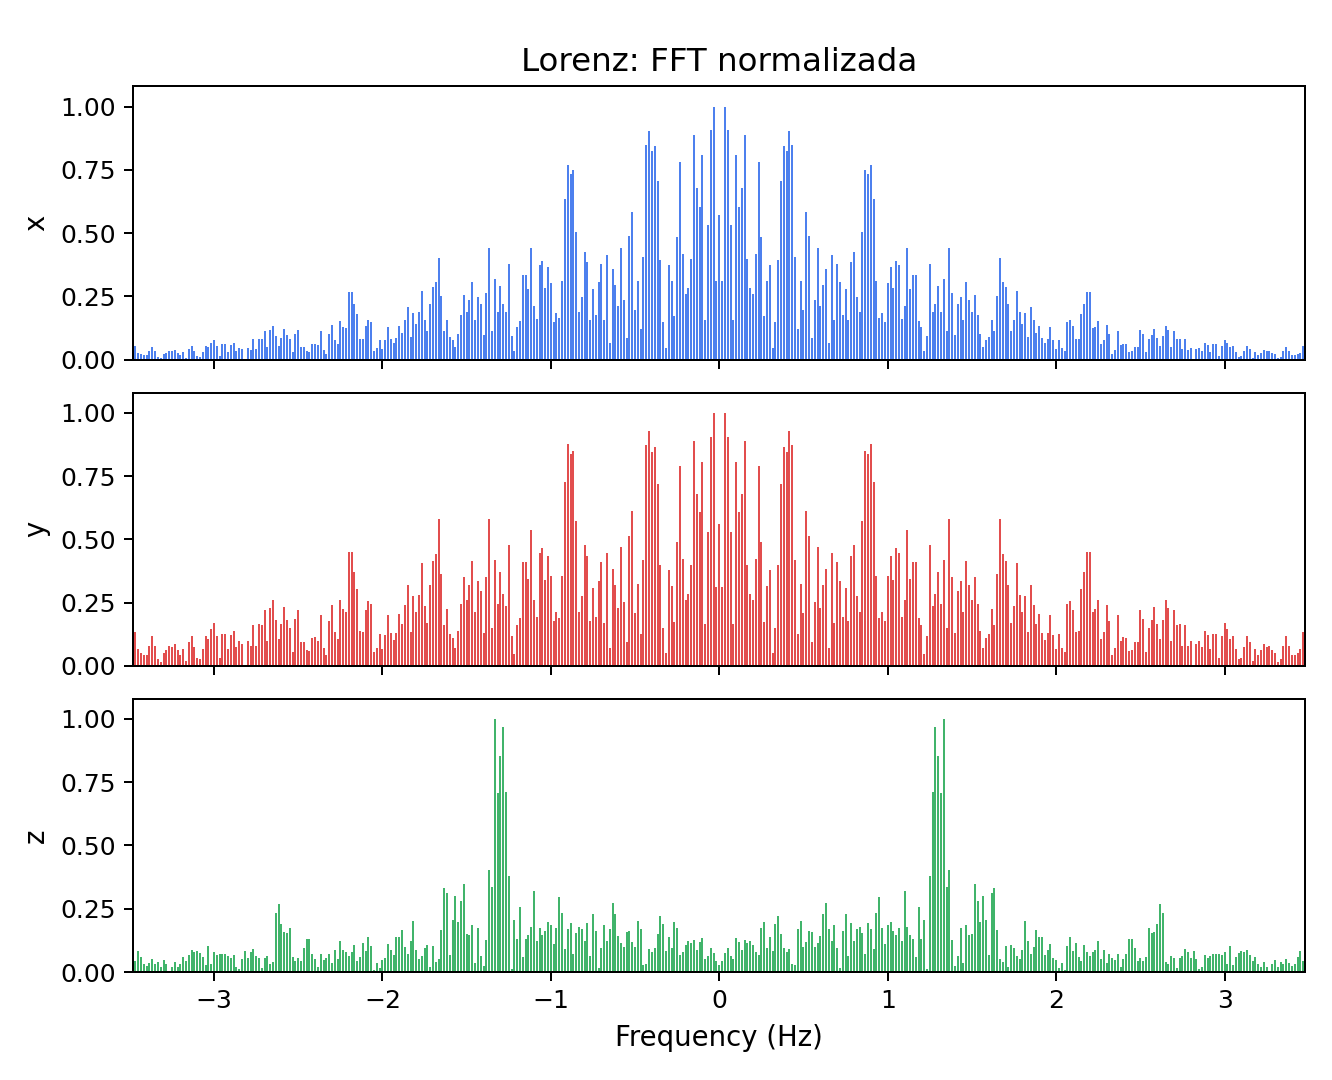
Reference outputs
What these views can show
Procedure
Step-by-step workflow
-
Name the experiment
Use a stable identifier that includes model and varied input, for example lorenz_rho_sweep or rossler_method_refinement. Avoid names such as final2 or good_plot.
Create one folder per study and a subfolder or structured prefix per run.
-
Record the model contract
Save catalog label, equation source or citation, parameter names and values in displayed order, initial-state labels and values, and whether the model is a flow, map, delay case, or custom definition.
For Crear sistema, save the validated JSON alongside the human-readable source of the equations.
-
Record the numerical contract
Save method, step size or iteration rule, duration or iteration count, discarded transient, divergence threshold where relevant, and application version.
For a sweep, record range endpoints, sample count or increment, retained points, plane, grid, and classifier settings as applicable.
-
Export the primary figure
Use the panel's Guardar gráfica control. Prefer PDF when scalable axes and line work are needed, and PNG when a fixed raster is appropriate.
Verify the saved file outside the application: labels must be readable, the expected plot must be present, and the file must open normally.
-
Preserve interpretation separately
Write what the computation directly shows, what is inferred, and which checks were performed. Keep unresolved questions explicit.
Do not rename an exploratory image in a way that upgrades it to proof or validation.
-
Package comparisons
Use a table with one row per run and columns for every changed or controlled setting. Include failures and divergent runs rather than retaining only attractive figures.
Check that every manuscript or slide figure maps back to one run identifier and one settings record.
Minimal run record
- run_id and date
- system label, equation reference, and parameter vector
- initial state
- method, step, duration or iterations
- transient handling and analysis-specific controls
- source tab and whether a shared trajectory was reused
- output filename and format
- direct observation, inference, checks, and limitations
Result
Expected output
- A folder containing readable figures, model information, numerical settings, and interpretation notes.
- A one-to-one mapping between every reported image and the run that generated it.
- A comparison table that makes controlled and changed inputs visible.
Interpretation
How to read it
Reproducibility does not mean that long chaotic trajectories remain pointwise identical across every platform. It means the model and computational contract are complete enough to repeat the experiment and compare declared quantities.
A trustworthy result package preserves failures, resolution checks, and ambiguity as well as the final presentation figure.
Export
Reproducibility checklist
- Model: equations/source, catalog or custom status, parameters, initial state.
- Numerics: method, step, duration/iterations, transient, analysis-specific settings.
- Software: Toolbox Chaos version and operating environment when relevant.
- Output: tab, format, filename, axes/variables, visual options, and run identifier.
- Evidence: interpretation, convergence or sensitivity checks, limitations, and unresolved outcomes.
Applications
Where this workflow helps
- Preparing figures and methods information for articles and theses.
- Sharing computational experiments within a research group.
- Building repeatable classroom laboratories and assessment keys.
Limits
What it does not establish
- A saved figure alone is not a reproducible dataset or experiment record.
- The GUI exports offered by each tab differ; do not promise a raw-data format that the visible control does not provide.
- Reproducible Toolbox output still does not certify hidden-attractor localization.